Integrations · Splunk
HoneyLabs threat intelligence in Splunk
The app on Splunkbase adds two search commands, two dashboards and two threat feed inputs. Install it, restart, and you can ask what the honeypot sensors already watched an address do, without leaving SPL. The lookup-table recipe further down needs no app at all, for the deployments where installing one is not an option.
What you get
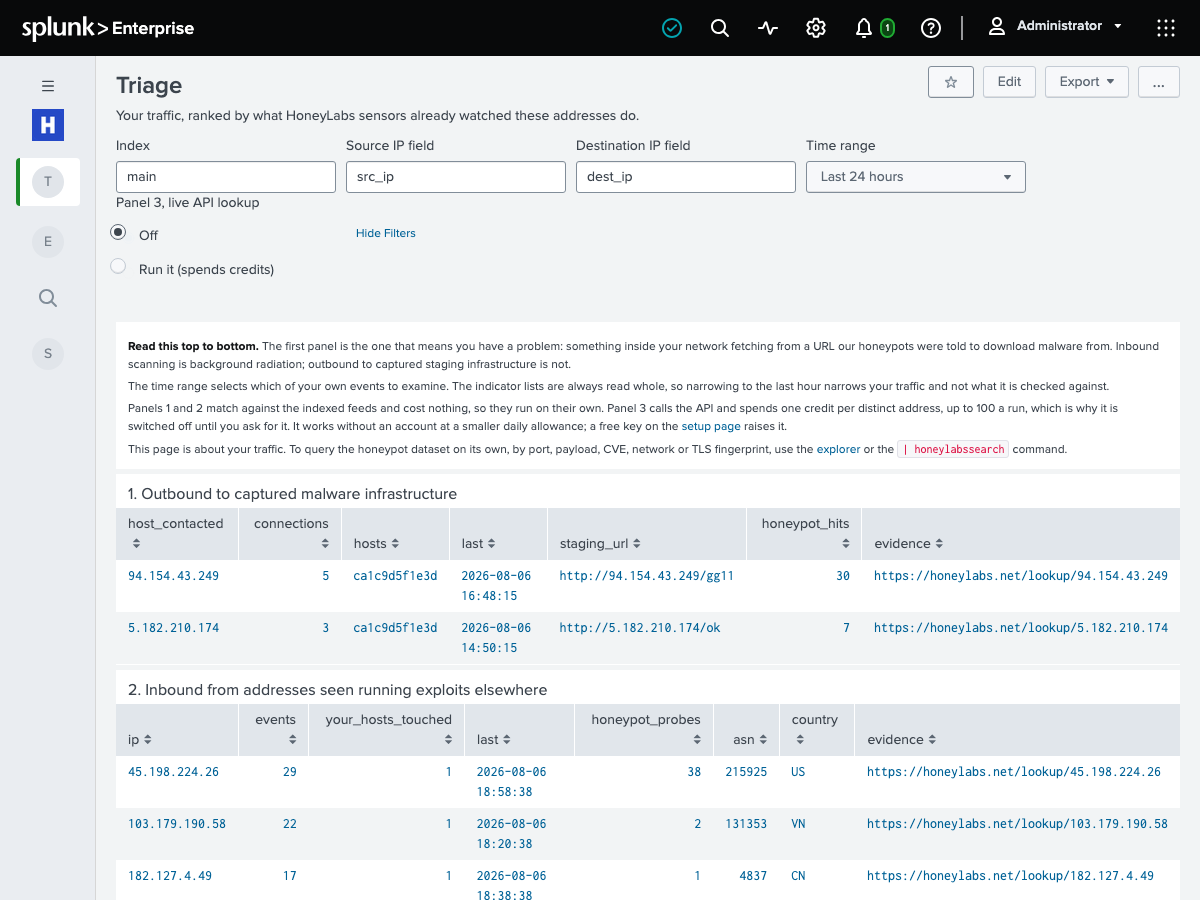
Find the hosts inside your network fetching from captured malware infrastructure
Honeypots get told to download things. Those staging URLs are recorded, and the Triage dashboard matches them against your proxy and firewall data. Inbound scanning is background noise; one of your own hosts reaching out to a URL a honeypot was handed is not. The dashboard reads the indexed feeds only, so it costs nothing and runs on page load.
Annotate any IP field in SPL, in place
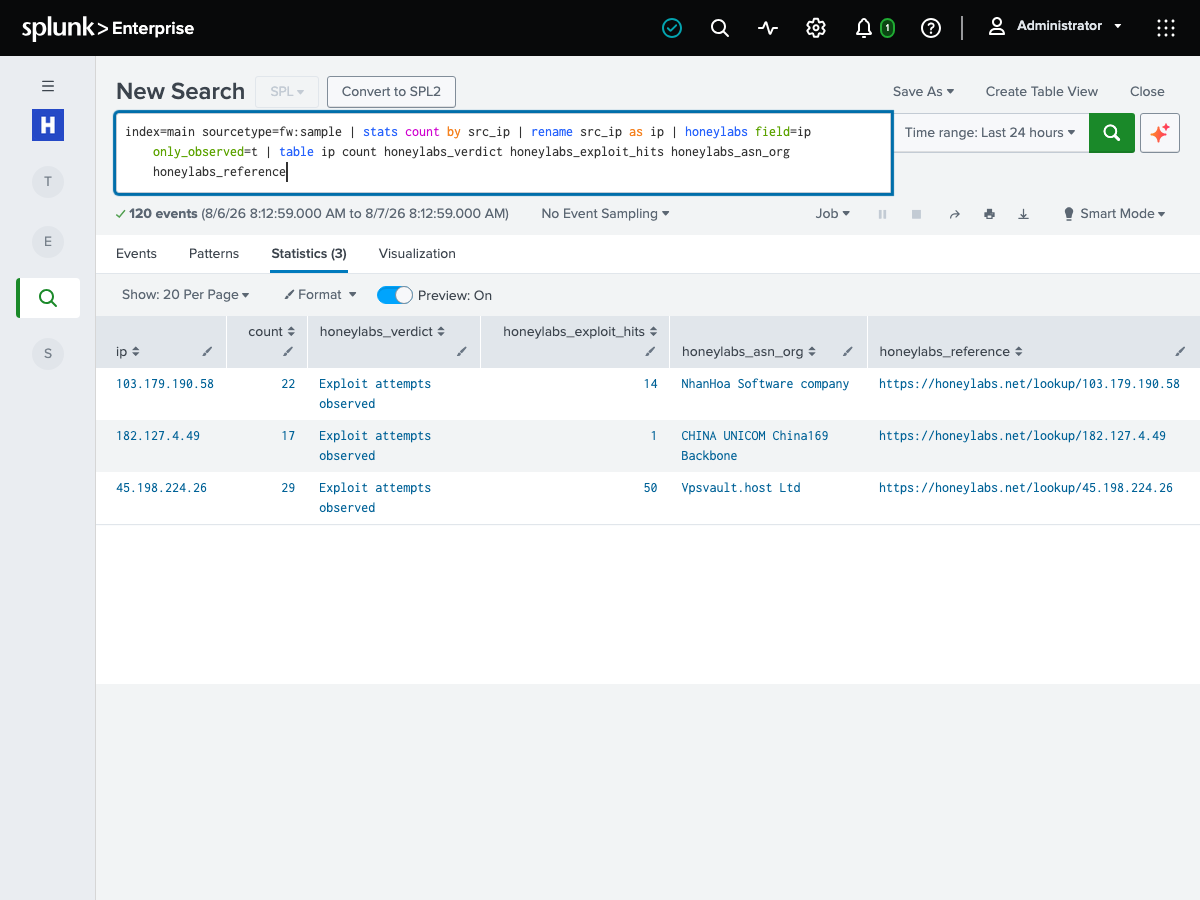
The honeylabs command takes a field holding a public IPv4 address and writes back a verdict, the exploit-path hit count, the ASN and its owner, first and last seen, and a reference URL to the full report. Addresses are batched per search chunk and memoised for the life of the search, so a scanner that appears ten thousand times costs one lookup.
Query the honeypot dataset when you have no local data at all
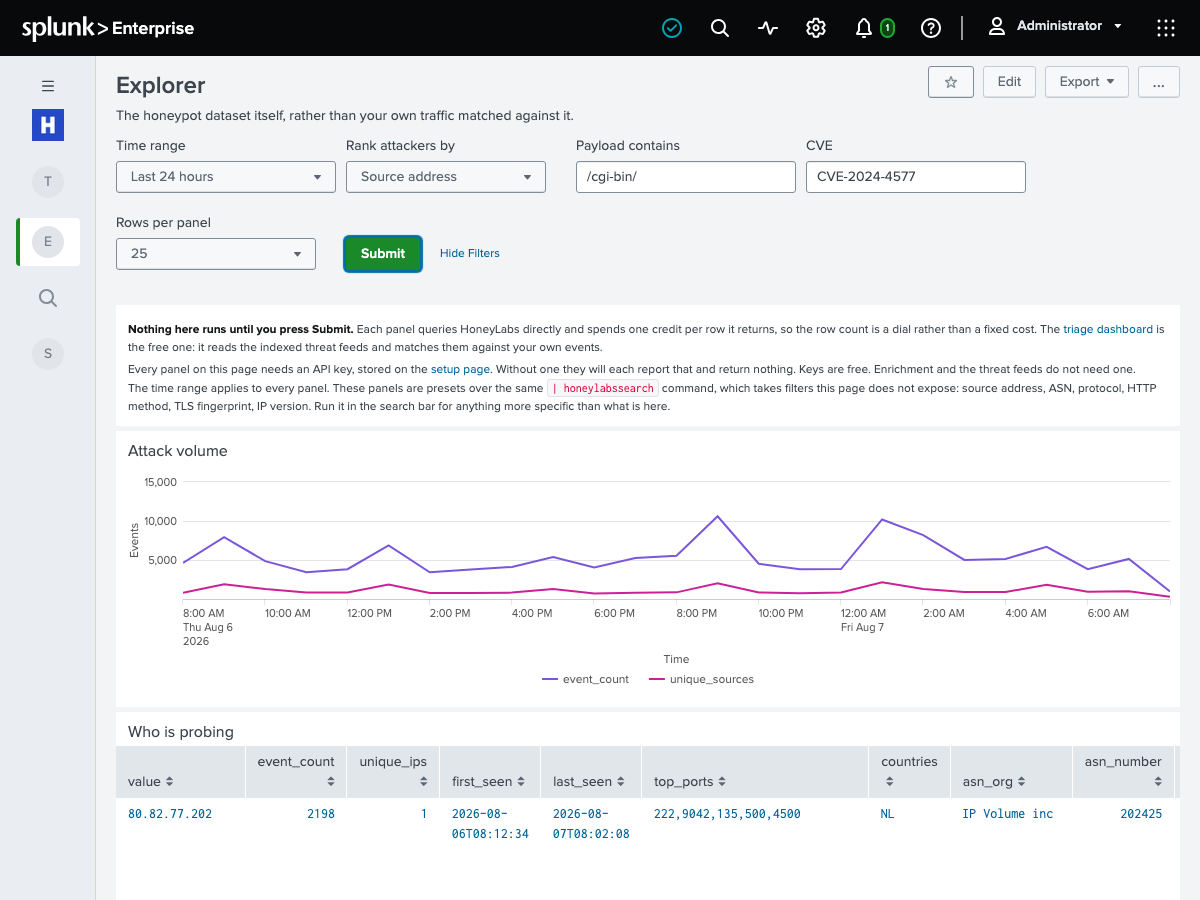
The Explorer dashboard and the honeylabssearch command read the sensor corpus directly: attack volume over time, who is probing, the request paths they ask for, a literal payload search, and who is going after a given CVE. This is the answer to a question about the internet rather than about your logs, so nothing needs to be in your indexes first.
Hunt a payload string across every sensor
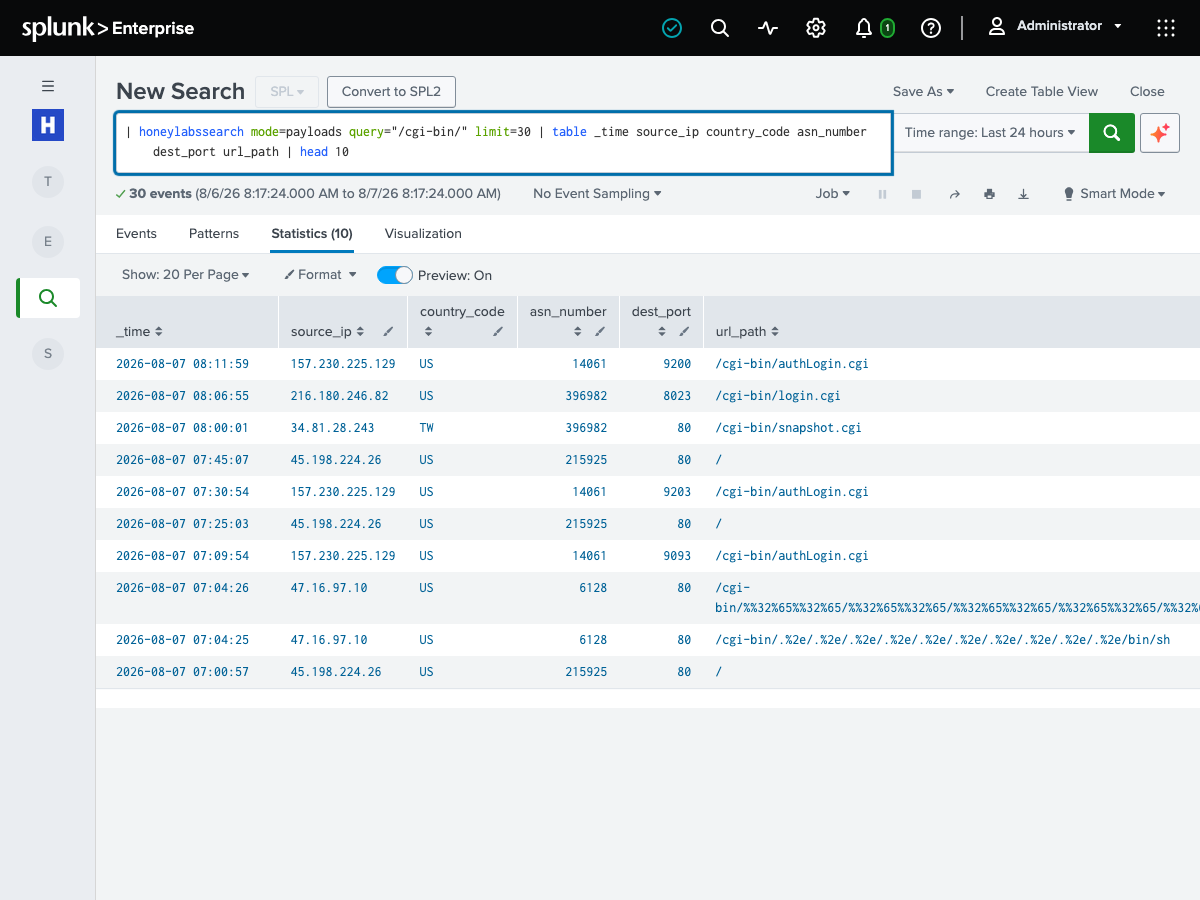
Pass a literal substring and get back the events whose captured request text contains it, with the source address, its network, the port it hit and the path it asked for. Useful when an alert gives you a URI and you want to know whether it is a targeted attempt or something being sprayed at the whole internet.
Wiring it up
- 01
Install the app from Splunkbase
Listed as HoneyLabs Intelligence, app 9360. Install it on a search head and restart. There is no setup gate: the honeylabs enrichment command, the Triage dashboard and both feed inputs work with no key at all. A free key, stored on the Setup page in the app's own navigation bar, raises the daily cap from 10 lookups to 500 and unlocks honeylabssearch and the Explorer dashboard. It is held in Splunk's storage/passwords, never in a .conf file.
# https://splunkbase.splunk.com/app/9360 # Apps > Manage Apps > Install app from file, then restart. # Confirm both commands registered | makeresults | eval ip="45.13.17.210" | honeylabs field=ip | honeylabssearch mode=attackers days=1 limit=5 # Enrich your own data index=firewall | honeylabs field=src_ip | where honeylabs_events > 0 | table _time src_ip honeylabs_verdict honeylabs_events honeylabs_asn_org - 02
Enable the threat feed inputs
Two modular inputs ship disabled. Turning them on indexes the active exploiter addresses and the captured malware staging URLs on a schedule, which is what the first two Triage panels match your traffic against. They are plain downloads of a public file and need no credentials. Feed events are stamped with when the sensors last saw the indicator, up to two weeks before index time, so search them over a window wide enough to cover that.
# Settings > Data inputs > HoneyLabs threat feed > New feed : exploiters # or malware-infrastructure interval : 3600 index : default # sourcetype defaults to honeylabs:feed # Or point one at a feed shaped by your own saved query: feed : https://honeylabs.net/feed/<token>.csv - 03
Save a query
Sign in (free) and save the HoneyLabs query you want the feed to track on the feeds page. Any lookup query works: a port, an ASN, a tag, or a boolean combination. The feed returns the source IPs currently matching it, so a tighter query means a tighter blocklist.
# Example saved queries and what they feed you port:22 AND NOT tag:scanner # SSH brute-forcers, known researchers removed tag:scanner # every recognized scanner IP cve:CVE-2024-4577 # IPs probing one specific CVE asn:14061 AND port:445 # SMB scans out of DigitalOcean - 04
Mint a feed token
On the same page, mint a feed URL for the saved query. The token alone authorizes the fetch: no cookies, no headers, safe to paste into an appliance. Mint one token per consumer so you can revoke a leaked URL without breaking the others.
# Your feed URL looks like https://honeylabs.net/feed/<token> # plain text, one IP per line https://honeylabs.net/feed/<token>.csv # ip,first_seen,last_seen,events,asn,country https://honeylabs.net/feed/<token>.json # same fields as JSON - 05
Refresh the lookup file
Cron on the search head (or a scripted input) writes the CSV where Splunk looks up lookup files. Five-minute refreshes are fine; the feed is edge-cached.
# /etc/cron.d/honeylabs-splunk */15 * * * * splunk curl -fsS 'https://honeylabs.net/feed/<token>.csv' \ -o $SPLUNK_HOME/etc/apps/search/lookups/honeylabs_scanners.csv # One-time: Settings > Lookups > Lookup definitions > Add new Name : honeylabs_scanners File : honeylabs_scanners.csv - 06
Use it in SPL
Join on the source IP field of whatever index you are searching. A null events field means HoneyLabs has not seen that IP in the feed's window.
index=firewall
| lookup honeylabs_scanners ip AS src_ip OUTPUT events asn country last_seen
| eval honeylabs=if(isnotnull(events), "known scanner", "clean")
| table src_ip honeylabs events country asn last_seen

# Alert idea: internal host talking TO a known scanner
index=proxy
| lookup honeylabs_scanners ip AS dest_ip OUTPUT events
| where isnotnull(events)
Worth knowing
- What leaves your deployment: the values of the one field you name, de-duplicated. Not the raw event, not your other fields, not your index, host or sourcetype names, not the search string. Private, loopback, link-local and reserved addresses are dropped locally before the request is built, so internal-only traffic never leaves. The feed inputs disclose nothing at all.
- Neither command can fail your search. A lookup that cannot be answered puts the reason in honeylabs_error on the affected events and a warning on the job, and a 4xx stops further requests for the rest of that search, so a spent quota costs one round trip.
- The app and the lookup table are not exclusive. The lookup answers 'is this IP in my blocklist' with no network call at search time; the app answers 'what exactly has this IP done' on demand.
- Running Enterprise Security? Point ES's own threat intelligence framework at the feed URLs instead of using the feed inputs here, so indicators reach correlation searches and risk scoring rather than only being searchable. Both commands stay useful alongside it. The field mappings are in the Splunk ES guide at /integrations/splunk-es.
- The app's threat feeds are the two public ones and need no token. The token above is for a feed shaped by your own saved query, which the public feeds cannot produce.
- Keep the saved query broad for enrichment (tag:scanner) and narrow for alerting (a CVE or port query), as two separate feeds.
- For per-IP detail beyond the feed columns, the lookup page returns full JSON: curl with Accept: application/json on /lookup/<ip>.
The feed is plain text (one IP per line), CSV, or JSON, is revocable per token, and is edge-cached for five minutes, so a tight refresh schedule never hammers anything. Create yours on the feeds page, or browse the other integrations.